Although I completed my in-country research in Botswana a little over a year ago, I continue my interest and research on Botswana energy matters, keeping in touch with the local energy news and activities of my colleagues working there. However, there is no substitute for being on the ground to fully understand the nuances of the local energy scene so I have drawn on the friendship, experience, and knowledge of Karen Giffard to assist me with my research. Karen lives in Botswana and is an electrical engineer, as well as the co-owner of So Solar, a solar company based in Phakalane, and she is now the very capable co-author of these updates.
We recognize that some of the information we have been able to collect is—as a result of availability and slow reporting—not as current at we would like, but we still feel the collection, analysis, and ready availability of this information, which draws from many sources, is a useful contribution.
In this first post, we take a look at the big picture – overall energy supply and use in Botswana. In an earlier post, information for Botswana’s 2012 energy supply and use was presented in the form of a Sankey flow diagram: below we present an updated version using 2015 data from the International Energy Agency (IEA).


There is a lot of data in this diagram, so let’s work from left to right to get a sense of some of the larger flows. On the left, we have the energy sources for Botswana. There are only four types: local biofuel (wood), imported electricity, locally mined coal, and imported oil products. For 2015, the total energy supply available in Botswana from these sources was 120 138 terajoules (TJ), originating as shown in the pie chart below.


Over one-third of Botswana’s energy supply is in the form of oil products, such as petrol and diesel. The green flows in the Sankey diagram show that these are mainly used in transportation and industry. A small amount was used to generate electricity from the diesel-fired power plants located in Orapa and Matshelagabedi. The small flow to non-energy applications is used largely as lubricants, oils, and greases for industry and transportation.
As shown by the thick black Sankey flows, Botswana produces and uses a good amount of coal. Most coal is used for the generation of electricity. It is striking to note that only 23% of energy in coal ends up as electricity: the remaining 77% is lost as waste heat. Owing to the increased in-country production of electricity and the coal mining that supports it, coal is now responsible for over 40% of Botswana’s energy supply.
Biofuel (largely wood) is still very important in Botswana: the brown biofuel flows show that all wood is used in household applications, most likely for cooking and heating in the rural and poorer areas.
Electricity supply and use are shown in red. Compared with the 2012 data, which showed that imported electricity was responsible for 12% of Botswana’s energy supply, the amount of imported electricity has decreased markedly and comprised only 5% in 2015. A lot more electricity is being generated locally due to the improved operability of the Morupule B power plant. The bulk of this electricity is used by industry, followed by households, and the commercial and public sectors.
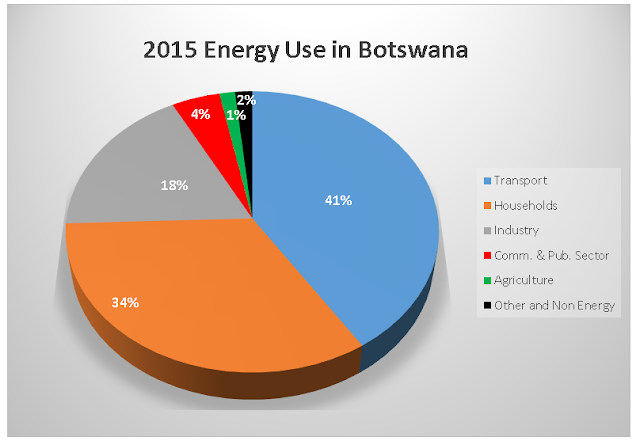
The overall usage of energy by the main categories, as shown on the right of the Sankey chart, is summarized in the pie chart below. The bulk of energy use (41%) is in transportation, followed by households, and then industry, where it is used largely in mining applications.

Botswana’s total energy supply for 2015 was 120 138 TJ, while energy consumption was 81 020 TJ. The large difference between supply and consumption is accounted for by the following reasons:
- More coal was mined than was actually used. Some 12% of mined coal was exported and some ends up in stockpiles to be used in the future.
- Electricity generation in coal-fired power plants is very inefficient. Only about 23% of the energy in coal ends up as electricity. The rest is lost as waste heat.
- Transmission and distribution of electricity to end users results in line losses of up to 15%.
- There are small differences due to statistical variations, own use, and storage of petrol and diesel at various locations.
When we compared the 2012 and 2015 data and Sankey diagrams, we noted the following major differences:
- The amount of electricity generated from locally mined coal has increased markedly, resulting in an increase in coal production;
- There has been an impressive decrease in imported electricity.
For comparative purposes, we have prepared the charts below using IEA data showing the history of energy supply and consumption.


Since 2000, overall energy supply has grown by a compounded rate of 3.2% per year, driven largely by increases in imported oil products (petrol and diesel) and coal mining. Biomass use has been steady. Imported electricity increased and peaked in 2012 and, as noted above, has seen a recent decrease.

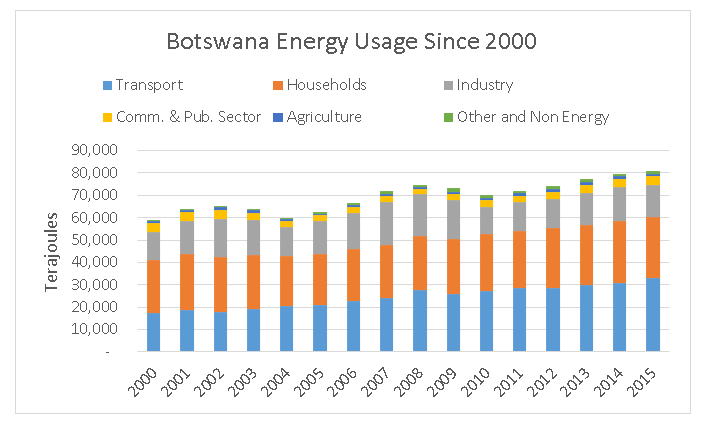
Since 2000, energy use has grown by a compounded rate of 2.1% per year, driven largely by increased use in transportation and smaller increases in household and industrial use.
In this post, we have focused on providing a “big picture” view of energy supply and consumption in Botswana. In Part 2, we will turn our attention to specific aspects of the energy situation in Botswana.
In the meantime, remember to turn off the lights when you leave the room.
Mike Mooiman and Karen Giffard
mooimanm@franklinpierce.edu
karen@sosolar.co.bw
No comments:
Post a Comment
Please feel free to comment but note that I have added a verification step to avoid the large amount of spam that can make its way into the comment area. An annoying but necessary step these days.