Sunday, November 12, 2017

2016/2017 Botswana Energy Update – Part 3: Electricity by Mike Mooiman and Karen Giffard

Following up on Part 1, in which we looked at the big picture of energy supply and use in Botswana, and Part 2 where we examined coal resources, we turn our attention in this post to electricity production, the Botswana Power Corporation, electricity tariffs, and appraise developments over the last few years.
Botswana Power Corporation (BPC) is the government-owned electrical utility and is the only entity that is responsible for the supply, transmission, and distribution of electricity throughout Botswana. As a result, discussions about electricity in Botswana often center on BPC and its operations and performance. Much of the electricity situation in the country is summarized in the figure below, where we have plotted data for the past 21 years. The blue bars show how the total annual amount of supplied electricity (generated locally and imported) has doubled over this time period. The orange line shows the percent of electricity generated in-country by BPC, largely from their Morupule operations. (Data for 2017 are estimates based on data from the first two quarters only.)
  Data Source: 1997 to 2004; Adjusted BPC annual report results. 2004-2017; Statistics Botswana

There are two important details to note from this chart. The first is the remarkable turnaround since 2011 in the amount of electricity generated in-country. It has increased from less than 10% in 2011 to an estimated 77% in 2017. This is a result of the improved operability of the Morupule B operation and it is likely that, within a few years, that Botswana could be generating enough power internally to supply all of its domestic needs. Remarkably, in July 2017, there was a report that Botswana had, for the first time, exported (!) electricity into the South African Power Pool for a short period.
The other point of note is that the amount of electricity supplied from both local generation and imports appears to have peaked and levelled off since 2014 at just below 4000 GWh. The data from the first two quarters of 2017 suggest that there might even be a further drop in electricity supply in 2017. This decrease in supply could result from several reasons: less demand from the mining industry due to the closure of the BCL copper and nickel mine, reduced diamond production, energy-efficiency drives, and perhaps more temperate weather that required less heating and cooling.
For many years, electricity generation in Botswana was a disappointment. The Chinese-built Morupule B 600 MW coal-fired power plant experienced operating problems right from the start. There were many problems with the contractor and operability of the equipment that impacted reliability and limited availability. A damning report released by the World Bank highlighted many project errors, including selection of an unqualified contractor, safety issues on site that resulted in five deaths during construction, and poor project overview by BPC.
According to the 2015/2016 BPC annual report, Morupule B only had availability of 55.8% compared with the expected 89%. Although progress has been made in improving the operability of this plant, problems with the contractor, China National Electric Equipment Company, remain and cost overruns have ballooned. The investment in Morupule B and the electricity imports to cover for its lack of operation are now of the order of 12 billion pula ($1.2 billion) and the Botswana government is negotiating to sell Morupule B back to the contractor, following which BPC will buy back the electricity though a power purchase agreement.
At the same time that Morupule B was being commissioned and was experiencing operating problems, the ageing Morupule A plant was shut down in 2013. To compensate for the Morupule B problems, a decision was subsequently made to refurbish the Morupule A operation. This is being undertaken by Doosan, a South Korean company. The scheduled completion date is December 2017, but delays have been experienced.
Despite the many problems associated with the Morupule B plant, the recent good news is that its operability has improved and, according to the chart above and data from a recent Statistics Botswana report, local generation of electricity has improved. In the first two quarters of 2017, more than 75% of the power needs of the country were locally generated. The equivalent numbers a year earlier were ~50%.
Even as the refurbishment of Morupule A is taking place and the reliability of Morupule B is being improved, plans for further expansions of Botswana’s generating capacity are underway. A 300 MW expansion of Morupule B to build two more 150 MW generating units (Units 5 and 6) was agreed to by a joint venture formed by Marubeni from Japan and Posco from South Korea. The joint venture was to act as an independent power producer and would design, build, and operate the plant to sell power to BPC under a negotiated power purchase agreement. However, progress on this project has now been halted owing to issues of loan guarantees for $800 million and contention regarding the proposed power purchase rates.
Negotiations are also underway with Kepco and Daewoo from South Korea to build another 300 MW (Units 7 and 8) of generating capacity. If all the units at Morupule are built and the refurbishment of the 132 MW Moropule A plant is completed, this would give Botswana a coal-fired generating capacity of 1332 MW. This would be well in excess of its present peak needs and will allow for electricity exports and growth in local demand.
It should be noted that the potential expansion of Morupule B and the award of contracts to foreign companies has been criticized by several local energy companies that have coal resources and that had made progress in developing their projects in order to bid competitively for greenfield 300 MW generating sites, in line with a 2013 Botswana government tender.
Generally speaking, there are a lot of electricity-generation projects on the drawing board and under discussion, including the mostly unexplored potential of solar generation. The table below lists the existing generating facilities (highlighted in yellow) and those in planning that we are aware of (highlighted in green). It is unlikely that all these projects will be developed, but it is encouraging that there is so much focus and interest in developing electricity generation in Botswana.


As Botswana’s only electricity utility, BPC has struggled with insufficient income and financial deficits for many years, although the annual report for 2015/2016 did show the deficit shrinking. Operating deficits have been made up by cash infusions from the government. As a result, electricity in Botswana is heavily subsidized. Recent BPC data show that ratepayers are paying only about 60% of the cost of electricity: the average cost for procured electricity in Botswana (local generation and imports) is 139 thebe/kWh (US$ 0.14 kWh), whereas the average selling price to ratepayers is 82.1 thebe/kWh (US$ 0.082/kWh).
BPC is working hard to transform itself and to deal with its operating deficit. It has recently appointed an ex-patriot CEO from Germany and has prepared a turnaround plan called MASA 2020 that focuses on cost cutting, operational efficiency, selling of assets, and working with independent power producers. In line with many power companies across the world, BPC is looking to transform itself into a transmission and distribution utility, as opposed to a fully integrated generation, transmission, and distribution entity. The plan to sell problematic Morupule B back to the contractor that built it is part of this strategy. BPC is attempting to address the deficit/government subsidy issue by increasing electricity prices and improving operational efficiencies. In April 2017, electricity prices were increased between 8 and 13%, with the largest increases leveled at medium and large businesses.
Another challenge for BPC is that not all of the electricity generated or purchased from the South African Power Pool makes its way to customers. There are expected losses in the transmission and distribution grid due to the resistance of the wires, but there are also losses due to theft or meters not correctly recording actual electricity usage. It is notable that the losses from the BPC grid are large. The chart below shows that the recorded electricity losses, as determined by the difference between supply and customer sales, generally exceed 10%; based on the most recent data, these losses have risen to 15%. Such losses are considered large: global average transmission and distribution losses numbers, as determined by the World Bank, are 8.3%. Losses at Eskom in South Africa are typically 9% or below. Electricity losses in other neighboring countries are also high, e.g., Zimbabwe at 16.4%, Zambia at 15%. This represents an important opportunity for improvement.


In summary, the electricity situation, at least in terms of local electricity generation, has much improved during the past few years and as a result coal mining has also increased. It seems that load-shedding (rolling blackouts), as experienced in 2013/2016, could be a thing of the past due to local generation improvements and reduced electricity import costs with the economic downturn in Southern Africa. However, dealing with electricity blackouts, due to unexpected or scheduled maintenance inconveniences, is still very much part of life and doing business in Botswana. Nevertheless, we are encouraged at the progress that has been made.
In Part 4 of this series, we turn our attention to renewable energy projects and various government programs directed at the energy sector.
In the meantime, remember to turn off the lights when you leave the room. 
Mike Mooiman and Karen Giffard

2016/2017 Botswana Energy Update – Part 2: Coal Projects by Mike Mooiman and Karen Giffard

Following up on Part 1, in which we looked at the big picture of energy supply and use in Botswana, we turn our attention in this post to coal mining and usage and examine some recent developments.
In Part 1 of this series, we noted that coal provided 41% of Botswana’s energy supply in 2015. According to data from the International Energy Agency (IEA), coal usage has grown by an annual compounded rate of 4.7% per year since 2000. Botswana has significant coal resources and it is clear that coal will continue to be an important resource well into the future.
Botswana’s coal resources can be utilized in several ways: the most obvious are the mining and burning of coal to produce electricity and coal exports. Most of the operating, planned, and proposed coal operations are associated with coal-fired electricity production and exports. However, the production of liquid fuels from coal, known as coal-to-liquid technology, and coal-bed methane, in which the natural gas associated with coal deposits is released by drilling into the coal seams, are also options under consideration.
The only operating colliery in Botswana is the Morupule Coal Mine, located near Palapye. This operation mines and prepares coal for the nearby Morupule power station. As noted previously, and highlighted in the following post, the amount of electricity generated in-country has increased significantly over the past few years due to the increased operability of the Morupule B power station. This has led to the increased mining of coal, as shown in the chart below. The refurbishment of the Morupule A power station and further expansions of the Morupule B power generation operations, discussed in Part 3, indicate that expansion of coal mining at this location is likely to occur in the future.
Source: StatsBotswana
The Morupule Coal Mine was previously owned by Debswana, the joint venture between DeBeers and the Botswana Government, but in 2016 a deal was struck for DeBeers (a subsidiary of Anglo American) to sell its 50% ownership of the colliery to the Botswana Government-owned Minerals Development Company. This is part of Anglo American’s drive to slim down its commodities profile. Anglo American had also been developing coal mining assets at the Mmamabula coal fields and had carried out feasibility and impact studies, but this work has been halted.
Several years ago, there was a flurry of project proposals to start up new coal mines for exports and to build new power plants on-site or close to these collieries to feed electricity into the Southern African Power Pool or the Botswana grid. As a result, the list of coal projects proposed for Botswana is long (see the Coal Projects in Botswana tab on this blog.) Most of these projects are at varying stages of preliminary assessment—some are still under review, some have completed detailed feasibility studies, and some are just proposals—but most are currently on hold because of the large capital investments required and low coal prices (see chart below).

Source: InfoMine

Nevertheless, some coal projects have gained traction. Shumba Energy has proposed to build two coal-fired power plants, 600 MW at Mabesekwa and 300 MW at Sechaba, supplied by locally mined coal. These are aimed at both local electricity supply and the export market. Prefeasibility studies at Sechaba have been completed. The 450 MW Sese project is a coal mine and power plant that is being developed by African Energy and First Quantum Minerals. The output for this project targets electricity exports to the Zambian mining industry.
Exporting coal is another way for Botswana to utilize its natural resources. Data from the IEA indicated that, in 2015, 10% of Botswana’s mined coal was exported. Detailed information on these exports are difficult to come by, but we suspect that these were to local markets in Namibia, Zambia, and Zimbabwe. However, export of coal from Botswana to international markets is difficult due to the lack of direct rail links to the port of Walvis Bay in Namibia or to Mozambique via Zimbabwe, and there is limited rail traffic to Richards Bay in South Africa. Moreover, exporters have to compete against large established coal mines in South Africa that have better access to transportation and export networks. There have been several proposals to build rail links to Namibia or Mozambique, but, owing to the associated cost and the current low prices for coal, there has been little progress of these beyond the discussion stage. 
There are other ways to use local coal resources, such as the production of liquid fuels from coal, known as coal-to-liquid (CTL) technology, similar to that carried out at Sasol in South Africa, and coal-bed methane (CBM), in which the natural gas associated with coal deposits is released by drilling into the coal seams. There has been some progress in the CTL area. Botswana Oil Ltd., the recently formed government-owned oil company responsible for secure fuel supply and promoting involvement in the oil industry, has hired a consultant and issued a request for expressions of interest, which were to be submitted by August 2, 2017, to design, build, own, and operate a CTL facility in Botswana. It should be noted that implementation of CTL is a large and very expensive endeavor. It is a technically complicated, capital-intensive, highly polluting process with high operating costs that require high oil prices to be profitable. There are a limited number of these operations in the world: the largest is the Sasol complex in Secunda, South Africa; there are also some in China and several smaller operations scattered around the world.
Exploitation of coal-bed methane (CBM) appears to hold more promise because the technology is not as capital- and engineering-intensive. The Botswana Ministry of Mineral Resources, Green Technology and Energy Security has issued a request for proposals for the development of electricity generation plants with 100 MW capacity fueled by CBM. Two companies were recently short-listed to develop CBM projects and to each build a 50 MW natural gas-fired power station: Tlou Ltd., out of Brisbane, Australia, and Sekaname, Pvt. Ltd., a subsidiary of Kalahari Energy. The former has been granted a mining license to proceed on development.
In Part 3 of this series, we turn our attention to electricity supply and generation in Botswana. In the meantime, remember to turn off the lights when you leave the room. 
Mike Mooiman and Karen Giffard

Friday, November 3, 2017

2016/2017 Botswana Energy Update – Part 1 by Mike Mooiman and Karen Giffard

Although I completed my in-country research in Botswana a little over a year ago, I continue my interest and research on Botswana energy matters, keeping in touch with the local energy news and activities of my colleagues working there. However, there is no substitute for being on the ground to fully understand the nuances of the local energy scene so I have drawn on the friendship, experience, and knowledge of Karen Giffard to assist me with my research. Karen lives in Botswana and is an electrical engineer, as well as the co-owner of So Solar, a solar company based in Phakalane, and she is now the very capable co-author of these updates.
We recognize that some of the information we have been able to collect is—as a result of availability and slow reporting—not as current at we would like, but we still feel the collection, analysis, and ready availability of this information, which draws from many sources, is a useful contribution.
In this first post, we take a look at the big picture – overall energy supply and use in Botswana. In an earlier post, information for Botswana’s 2012 energy supply and use was presented in the form of a Sankey flow diagram: below we present an updated version using 2015 data from the International Energy Agency (IEA).


There is a lot of data in this diagram, so let’s work from left to right to get a sense of some of the larger flows. On the left, we have the energy sources for Botswana. There are only four types: local biofuel (wood), imported electricity, locally mined coal, and imported oil products. For 2015, the total energy supply available in Botswana from these sources was 120 138 terajoules (TJ), originating as shown in the pie chart below.


Over one-third of Botswana’s energy supply is in the form of oil products, such as petrol and diesel. The green flows in the Sankey diagram show that these are mainly used in transportation and industry. A small amount was used to generate electricity from the diesel-fired power plants located in Orapa and Matshelagabedi. The small flow to non-energy applications is used largely as lubricants, oils, and greases for industry and transportation. 
As shown by the thick black Sankey flows, Botswana produces and uses a good amount of coal. Most coal is used for the generation of electricity. It is striking to note that only 23% of energy in coal ends up as electricity: the remaining 77% is lost as waste heat. Owing to the increased in-country production of electricity and the coal mining that supports it, coal is now responsible for over 40% of Botswana’s energy supply.
Biofuel (largely wood) is still very important in Botswana: the brown biofuel flows show that all wood is used in household applications, most likely for cooking and heating in the rural and poorer areas.
Electricity supply and use are shown in red. Compared with the 2012 data, which showed that imported electricity was responsible for 12% of Botswana’s energy supply, the amount of imported electricity has decreased markedly and comprised only 5% in 2015. A lot more electricity is being generated locally due to the improved operability of the Morupule B power plant. The bulk of this electricity is used by industry, followed by households, and the commercial and public sectors.
The overall usage of energy by the main categories, as shown on the right of the Sankey chart, is summarized in the pie chart below. The bulk of energy use (41%) is in transportation, followed by households, and then industry, where it is used largely in mining applications.


Botswana’s total energy supply for 2015 was 120 138 TJ, while energy consumption was 81 020 TJ. The large difference between supply and consumption is accounted for by the following reasons:
  • More coal was mined than was actually used. Some 12% of mined coal was exported and some ends up in stockpiles to be used in the future.
  • Electricity generation in coal-fired power plants is very inefficient. Only about 23% of the energy in coal ends up as electricity. The rest is lost as waste heat.
  • Transmission and distribution of electricity to end users results in line losses of up to 15%.
  • There are small differences due to statistical variations, own use, and storage of petrol and diesel at various locations.
When we compared the 2012 and 2015 data and Sankey diagrams, we noted the following major differences:
  • The amount of electricity generated from locally mined coal has increased markedly, resulting in an increase in coal production;
  • There has been an impressive decrease in imported electricity.
For comparative purposes, we have prepared the charts below using IEA data showing the history of energy supply and consumption.


Since 2000, overall energy supply has grown by a compounded rate of 3.2% per year, driven largely by increases in imported oil products (petrol and diesel) and coal mining. Biomass use has been steady. Imported electricity increased and peaked in 2012 and, as noted above, has seen a recent decrease.


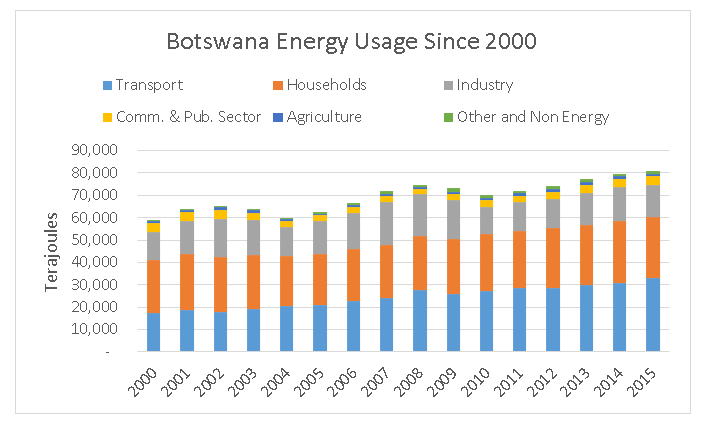
Since 2000, energy use has grown by a compounded rate of 2.1% per year, driven largely by increased use in transportation and smaller increases in household and industrial use.
In this post, we have focused on providing a “big picture” view of energy supply and consumption in Botswana. In Part 2, we will turn our attention to specific aspects of the energy situation in Botswana.
In the meantime, remember to turn off the lights when you leave the room. 
Mike Mooiman and Karen Giffard
mooimanm@franklinpierce.edu
karen@sosolar.co.bw

Monday, June 20, 2016

Diesel vs. Solar Generated Electricity in Botswana

Dumela*. As I have been travelling around Botswana visiting solar installations and chatting to solar system owners, I have encountered a lot of solar photovoltaic (PV) systems that have a diesel generator as back-up and so I have been fielding—and asking—a lot of questions about diesel versus solar. Most of my research has focused on solar systems with battery storage, but I decided that it was worth learning a little more about diesel generators: when and how they might be best combined with solar systems. In this blog, I share with you some of what I have learned.

Diesel (or petrol) generators have been around for a long time. They are robust and reliable, and there are numerous units from various manufacturers available in different sizes for different applications. They vary from small emergency generator units, which have a capacity of 2 to 5 kW, that you can purchase in a large supermarket along with your building supplies or groceries, to large units that serve as a back-up electricity supply for lodges, to even larger units that can power mining operations.

Diesel generators can even be used to add on-demand generating capacity to the electrical grid. For example, the Botswana Power Corporation (BPC)-owned 90 MW back-up generator operation in Orapa consists of two 45 MW GE LM 6000 turbine/generator units. Based on their specification data, when they are both running, these units can consume up to 22 000 liters of diesel per hour – that is almost one diesel tanker truck of fuel every sixty minutes! With diesel presently priced at about P 7.30/liter (US$2.52/gal), we can calculate that the Orapa station is, at capacity and just in terms of its fuel costs, generating electricity for ~P 1.78/kWh.

When considering off-grid electricity systems, the decision is usually made between selecting solar or a generator. In many respects, a diesel generator seems like a straightforward solution. The upfront costs are lower than those of a solar system; a generator is not dependent on sunlight and weather conditions; it does not need battery storage, and it is fairly easy to find technical assistance when the generator is not working. A small generator can even be loaded onto the back of a truck and transported to the repair shop.

On the down side, diesel generators are noisy, low-efficiency, highly polluting devices that require the transportation and storage of diesel. Typically, only about 25 to 37% of the energy in diesel is converted to electricity: the rest is lost as heat from the engine block and the hot exhaust gases.

Another complicating aspect of diesel generator operation is that generators burn a minimum amount of fuel, even at very low electrical demands. As Figure A shows, for a range of generator sizes, fuel consumption increases as the electrical load increases; however, at very low electricity demand, the consumption levels off. As a result, generators can be horribly inefficient (<15%) and wasteful devices at low loads. This escalates the cost of producing electricity at low demand levels, as shown in Figure B. If you need to turn on just a single light, you will need to fire up the generator–which will consume a minimum amount of fuel. It is for this reason that generators are often paired with some battery storage that can take care of minimum load requirements. Also bear in mind that these cost data were calculated using a relatively low diesel cost of P 7.30/liter: as recently as 2014, diesel was selling for over P 10/liter (see Figure C below).


Data Source: Able Sales
Data: World Bank and OANDA

Figure B indicates that the fuel costs of generating electricity from diesel generators is of the order of P 2.00 to P 2.20/kWh at demand levels above 50%, but this is only part of the story. To get a sense of the overall true costs of diesel generation, we need to include the purchase and maintenance costs of the generator.

To calculate the all-in lifecycle costs, we need to calculate the levelized cost of energy or LCOE. This parameter takes into account the initial cost of the unit, its electrical output, the annual cost of fuel, annual maintenance, and an interest cost (normally set by the minimum rate of return one would like to earn on a project and is often equivalent to the bank loan interest rate to purchase the equipment). These costs are then distributed evenly over the life of the project to yield a single “levelized” cost for energy. The attraction of the LCOE approach is that it allows a side-by-side comparison of different projects and energy sources that have very different financial requirements and expense flows. For example, it allows comparison of a solar system with high capital but low operating cost with a diesel generator project that has low capital but high operating costs. LCOE provides a means for determining which project is better from a lifecycle energy cost point of view.

Calculating the LCOE from scratch can be challenging as it is a rather involved financial calculation, but there is a great site, from the National Renewable Energy Laboratory in the US,  that can do the calculations for you. I used this to calculate the LCOE for a diesel generator. My set of assumptions included the following:

Capital cost: P 5000/kW ($ 450/kW @ P 11/US$)
Capacity factor: 90% (Generator runs most of the time)
Project lifetime: 10 years
Interest rates: 10% (Prime (6%) + 4%)
Diesel consumption rate: 0.27 L/kWh
Costs for diesel: P 7.30/L ($ 2.41/gal, June 2016)
Cost per kWh: P 1.71/kWh ($ 0.17/kWh)
Annual maintenance costs: P 330/kW ($ 30/kW)


With these assumptions, the calculator yielded the results in the figure above, indicating that the LCOE for a diesel generator is of the order of $ 0.183/kWh or P 2..01/kWh. I then computed the variability of the LCOE with high and low levels of some of the assumptions and generated the chart below. 

 
The data indicate that the cost of energy from diesel is most sensitive to the cost of diesel. Large increases in diesel prices lead to much higher costs for generated electricity; big increases in the cost of the generator do not significantly impact the electricity cost. The chart shows, within this span of assumptions, that the range of LCOE for diesel generators varies from P 1.86 to P 3.38/kWh, with a median value of P 2.62/kWh. To put these values into context, it should be noted that the average resident in Botswana, using more than 200 kWh/month, is paying P 0.88 per kWh (US$ 0.08/kWh @ P 11/US$) for electricity from the grid. In other words, within our chosen range of assumptions, the median cost of diesel-generated electricity is three times that of electricity purchased directly from BPC. So, if you have a grid connection and you install a diesel generator, do not consider the generator as a substitute for BPC: it is there to be used only when electricity is not available during load shedding.

Returning to the central theme of this blog (that of solar vs. diesel), let’s have a look at the LCOE for an off-grid solar installation with battery storage. The assumptions that I used for this calculation are as follows:

Capital cost: P 60 050/kW ($ 5500/kW @ P 11/US$)
Capacity factor: 90% (With battery storage, the system operates most of the time, like a diesel system)
Project lifetime: 10 years
Interest rate: 10%
Cost for fuel: Free!
Annual maintenance costs: P 55/kW ($ 5/kW)

I used local prices for the installed cost of a solar system with battery storage that I obtained from vendors here in Botswana. I also chose 10 years as a project lifetime to allow a direct comparison with the diesel project and because this is the typical lifetime of batteries under ideal conditions.  However, I will note that battery lifetime in Botswana can be a lot shorter as a consequence of the impact of high ambient temperatures.

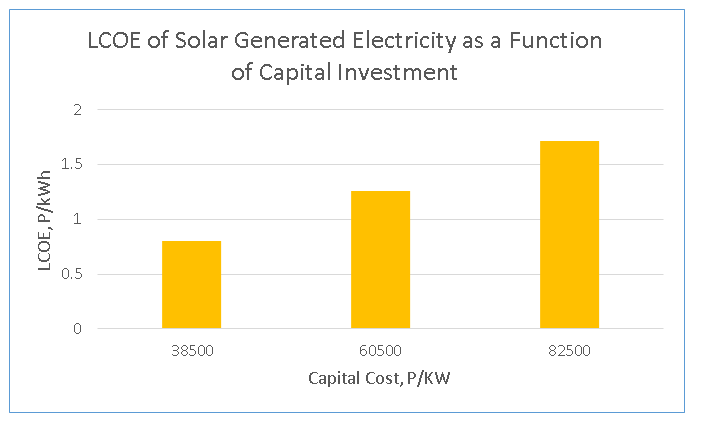
Using the above assumptions, the LCOE for solar power calculates at P 1.25/kWh. This is still higher than the cost of grid-supplied electricity from BPC, but is almost half the cost of diesel-generated electricity.  The chart below shows how the LCOE changes with capital costs: as expected the costs for solar generated electricity are highly sensitive to the upfront costs.


LCOE comparisons for diesel vs. solar with battery storage are summarized in the table below.

It should be noted that I have included some pretty significant assumptions in my calculations, but the key points to note from these data are that (i) the capital cost of solar plus battery storage is 12 times that of a diesel generator with the equivalent capacity; (ii) the lifetime costs of electricity for diesel generators are twice that of solar. These options are both more expensive than electricity from the grid in Botswana.

When considering diesel vs. solar, the decision comes down to one of high upfront costs and low long-term operating costs compared with low upfront costs and high operating costs. It is clear from the financial data that solar, even with the costs of battery storage included, is the better option. The biggest obstacle to investing in solar is finding that substantially larger amount of money for the one-time installation of the solar and battery storage system.

However, (as these matters often are) it is sometimes not a black or white decision. Sometimes a hybrid solution, using a combination of solar and diesel, is the correct one. I noted in an earlier blog the disappointment many purchasers of solar have experienced due to poor battery and system performance. As I read and learn more, I am becoming convinced that the correct solution for off-grid systems is not diesel or PV: it is a hybrid of both. A long run of overcast days can really compromise the electricity output of a PV/battery storage system, so installing diesel generators alongside solar systems in a hybrid configuration can compensate for these weather shortcomings.

There are several other reasons why hybrid systems are a good choice. These include:

  • Improved reliability – crucial for service-oriented businesses, such as tourist lodges, which cannot afford to be without electricity;
  • Reduced capital costs – some diesel-generation capacity reduces the size and cost of the battery bank and solar array;
  • Better for short-term high-demand applications, such as stoves, welding machines, hairdryers, etc.;
  • Reduced emissions compared with a generator-only solution;
  • Reduced exposure to future diesel price increases;
  • Modular solutions are possible. As PV and battery prices decrease, more modules and/or batteries can be installed, leading to reduced fossil fuel use;
  • More system design options become available, for example, PV and no storage with generator or PV plus battery storage and a generator;
  • A hybrid solution is a partially “green” solution, but still allows optimization of capital expenditure. It avoids overspending on capital costs or underspending and then suffering from very high fuel costs.

Hybrid systems combining solar and diesel generators are growing in importance.  A number of island communities use them and there are a growing number of mining companies powered by diesel generators and using millions of liters of diesel fuel per year to power their operations that are finding big savings by introducing some solar generation into their energy mix. If you are interested in exploring hybrid options, I encourage you to take to look at the Homer Energy website and their Homer modelling tool. This enables you to investigate a range of hybrid options, all the way from 100% diesel to 100% solar and calculate the LCOE for each option. In this way, you can determine the optimal combination of solar and diesel for your application.


In conclusion, hybrid options seem to offer the best of both worlds. A hybrid system should have upfront capital costs somewhere between those of a diesel-only solution and a solar/battery storage system; the LCOE should similarly lie between those of both options. In turn, the resulting system has a higher degree of reliability, less weather sensitivity, and permits the installation of more solar and battery storage as time and finances allow. However, a combined system will no doubt be more complicated to operate, so if you have any direct experience with hybrid systems and their performance in the field, please share it with us in the comment box below.

In the meantime, remember to turn off the lights when you leave the room. 

Tsamayang Sentle**
Mike Mooiman
mooimanm@franklinpierce.edu


(*Greetings in Setswana)
(**Go well or Goodbye in Setswana)

Tuesday, March 15, 2016

Off-Grid Solar Power in Botswana

Dumelang*. My previous post looked at the limited number of grid-connected PV systems in Botswana. There appear to be only three of noteworthy size (>10 kW) and a small number of lower power residential systems. In this post, I turn my attention to off-grid systems, of which there are many more throughout Botswana, but let’s start by reminding ourselves about the differences between grid-connected and off-grid systems.

In grid-connected systems, the electricity flow is one of three types:
  1. Outwards only, whereby power generated by the solar operation is fed into the electrical grid to supplement the power produced by other power plants, e.g., the Phakalane solar farm;
  2. Inwards only, where the grid just serves as a backup and feeds electricity into the system when insufficient solar energy is being produced, e.g., the 34 kW system at Scales Associates in Broadhurst, or
  3. Bidirectional, whereby excess power, over and above that used locally, is fed into the grid during the day, but during the night power is drawn from the grid, e.g., the University of Botswana experimental project in Mokolodi Village.
In off-grid solar systems there is no connection to the electrical grid and these installations are typically found on homes, on farms, in villages, or at tourist lodges in remote areas. Because these systems cannot use the grid for back-up electricity supply, they usually incorporate batteries so that any excess energy, produced during the day, can be stored for use during evening hours. Off-grid installations are sometimes combined with other means of electricity generation, such as diesel generators, that can provide backup power during cloudy conditions or when the batteries are depleted. These are referred to as hybrid systems.

Understanding these off-grid systems requires knowledge of the four key electrical components of the solar system: the panels, batteries, inverters, and charge controllers. In an earlier blog I provided some details on the functions of these components. The figure below shows key components in the basic layout of an off-grid solar system.

As I drive around Botswana, I see off-grid systems almost everywhere I go. They range from small single-panel systems providing a small amount of power for few lights or mobile phone charging, to multi-panel systems powering a home/ farm or a borehole pump, to large systems powering tourist lodges in the Okavango Delta. My research at the Clean Energy Research Centre at the University of Botswana is focused on these off-grid systems and particularly the battery-storage component. I am visiting these systems, chatting to the owners about the performance of the units, taking measurements, and collecting data.

As I have noted before, there has been a big push for installing solar systems in Europe, USA, and parts of Asia. These installations range from residential installations to large grid-scale systems of the order of 500 MW. Most folks in the US and Europe who are installing solar systems on their homes or business are installing grid -connected systems. The driver for the rapid rollout in these locations is purely financial. Electricity in these places is expensive and attractive subsidies for renewable energy are available. Only a small fraction of these new solar installations are off-grid systems and they tend to belong to hardy self-sufficient folks looking to live “off the grid” or owners of holiday homes and cottages located in rural areas that are far from the grid.

In the developing world, and here in Africa, off-grid solar is a whole other matter. In an isolated community where a grid connection is not possible due to distance or the cost of connection, energy options are limited. Many people live without power and rely on wood for light and cooking, or sometimes they use kerosene and candles. If they have a generator, they have to deal with the transportation and expense of diesel to keep the unit running as well as the maintenance of the engine. Off-grid solar systems are often the only viable way to bring electricity to remote homes, communities, businesses, and tourist facilities. Once solar is installed the fuel, sunshine, is free and maintenance is fairly simple and a lot less than that involved than that required for a diesel generator.

On the surface, off-grid systems appear to offer many advantages:
  1. The obvious one is that they are not grid-connected: they thus avoid long waits to get a grid connection and save on grid connection fees, which can range from as little as P5000 (~US$450) for residences located closed to the grid to hundreds of thousands of pula for locations far away from the main grid.
  2. Once the investment is made, the sunlight is free, which can significantly reduce the daily operating costs of the installation, However, as I will point out in a future blog, even though this is often a compelling reason for solar, it is a simplistic assumption. The correct analysis is to consider the upfront costs as well as the operating costs or the total lifetime costs.
  3. Solar is “green” and a more sustainable energy option and avoids the noise and pollution of a diesel generator as well as the logistics of trucking and transporting large quantities of diesel into remote areas. In fact, for many tourist camps and lodges this becomes an important part of the branding and selling point for their operations. Visitors can visit remote camps and enjoy the peace and quiet of the African bush, and still have access to their electronic devices and other modern conveniences, such as gourmet coffee, hairdryers, hot water, and air conditioning, without a noisy diesel generator puttering away and polluting the environment. I, for one, have stayed at one of these lodges and when it becomes necessary for an operator to turn on the diesel generator late at night when the batteries are depleted, the racket, after the quiet of solar power, can be quite jarring.

On the other hand, off grid-solar systems present a variety of problems:
  1. The upfront capital costs are high.  Solar systems are expensive, especially when compared with an equivalent diesel system. Moreover, the need for battery storage can often double the investment cost.
  2. Excessive heat is a problem for solar systems. In a previous blog, I noted that solar panel performance decreases as temperature rises, so the high ambient temperatures and the high panel surface temperatures can significantly decrease the expected output and even the life of solar panels. Similarly, battery lifetimes and performance are very temperature-dependent. Batteries do not like high temperatures and their lifetimes are considerably shortened in Botswana’s hot conditions.
  3. The output of a solar system is very dependent on weather conditions. The ideal conditions are cool sunny days; day after day of cloudy weather will seriously compromise the functioning of a solar system. After the sun goes down, the performance of the system is dependent on the installed battery capacity and operation of the battery bank.
  4. For large loads, large numbers of solar panels and batteries are needed, which means that a large amounts of space for their installation are required. In a space-constrained operation, say an island-based tourist camp in the Okavango Delta, this could present a problem.
  5. Unlike a diesel generator, every solar system is a custom built and the performance of the installation is very reliant on the competence and experience of the solar contractor.
  6. The lifetime costs of solar, which include the upfront investment cost, maintenance costs, and battery replacement, can be high especially when compared with grid-supplied electricity.
I have visited a good number of off- grid solar systems in Botswana, ranging from single-panel systems to large multi-panel installations with massive battery storage and have learned a great deal about the performance of these installations in general. Here are some of my findings:
  1. There are a lot of off-grid solar of different scales and sizes scattered through Botswana. These range from 50 W single-panel systems used for cell phone charging and a few lights to 100 kW multi-panel systems at lodges in the Okavango Delta.
  2. The solar portion and electronics are, for the most part, robust and work well. However, panel degradation has been seen in some cases. I have seen panels with cracks in the glass which have allowed in moisture and I have seen panels with a distinct browning of their appearance. See the photos below. The browning is due to the degradation of the organic material (ethylene vinyl acetate) that is used to encapsulate the individual solar cells in a panel. This degradation is accelerated at high temperatures and by high solar irradiation – both of which are plentiful in Botswana.
  3. I am surprised at how many non-functioning systems I have found. Often times, systems have been donated to communities that benefit initially from the installations. This is then followed by years of a lack of attention and post-installation follow up. As a result, three to five years after installation, the systems are no longer working. In some respects, this is a typical development problem – well-intentioned donors donate systems which are installed and are just left to community to run. Insufficient thought is given to developing local expertise or training nor is any provision made for follow up.  Years later, when problems occur, there is nowhere for the community to turn to for repairs and, as a result, systems, which initially provided a benefit, sit idle.
  4. There is a lack of branding with solar systems and little public knowledge as to what to constitutes quality for these installations. Solar systems are built from a number of components and purchasers are reliant on the design expertise of their solar contractor and the equipment choices those contractors make. It is unlike buying a car where, if you pay a lot of money for a Mercedes, you can be sure you are getting the benefits of great German engineering, quality components, and great after-market service. With solar power, there is no single Mercedes brand – you are reliant on your vendor making the correct design and component choices for you. I will note that many solar vendors, concerned about their reputation, will make the correct choices; however, as with cars, watches, and many other consumer goods, you get what you pay for. Buying cheap components or trying to save money by installing fewer panels or batteries will result in an inadequate solar system.
  5. Load creep is a problem. Often a system is designed for a specific load, say on a farm, to run lights, a fridge, a TV, and a borehole pump. Over the years, more electrical devices are purchased, such as a second TV, more lights, a freezer, a printer, etc. As result, the electrical load grows and, after a number of years, the system is inadequately sized for the demands placed on it.
  6. Many folks, ranging from individuals, to businesses, to high-end tourist lodges, are to varying degrees disappointed in their installed solar systems. The solar systems initially appeared to provide an elegant, sustainable, quiet, non-polluting alternative to a diesel generator. Invariably, the disappointment is associated with the inadequacy and shorter-than-expected lifetimes of the battery-storage systems.
  7. The Achilles heel of just about every system I have visited are the batteries. The battery life is generally half, or even less in some cases, of that expected. This seems to be result of:
      • Poor system design and insufficient solar panel output;
      • Lack of battery maintenance;
      • High operating temperatures;
      • Greater draw on batteries than originally planned.

Many of these problems can be overcome by the correct design, the right components, and spending oddles of money for both, which bring us to the fundamental problem that plagues solar systems: high upfront costs. In my next blog, I will take a closer look at this problem and dig into a comparison of the lifetime costs of solar vs. diesel.

Until next time, remember to turn off the lights when you leave the room. 


Tsamayang Sentle**
Mike Mooiman
mooimanm@franklinpierce.edu


(*Greetings in Setswana)

(**Go well or Goodbye in Setswana)