Wednesday, November 18, 2015

Under Pressure – Botswana’s Coal Energy Resources

Dumelang*. As I have been reading the local press, internet articles and other literature, I was surprised at the number of coal-based projects that have been proposed for Botswana over the years. I was having trouble keeping them all straight so I decided to collect, summarize, and tabulate these coal projects. At the same time, I wanted to take a hard look at coal as an energy resource.

It is generally believed that Botswana has significant coal resources and it is clear, based on the existing, planned, and proposed projects listed in the table in the Coal Projects in Botswana tab on this blog, that coal will continue to be an important resource for Botswana well into the future. These projects range from the new coal-fired generators at Morupule, the refurbishment of the Morupule A operation, new coal-fired operations, coal-bed methane, coal-to-liquid projects, and new mining operations.

A number of years ago there was a flurry of project proposals to start up new coal mines and to build new power plants on-site or close to these collieries to feed electricity into the Southern African Power Pool. However, since the construction and partial commissioning of the large Kusile (4800 MW) and Medupi (4800 MW) coal-fired projects in South Africa, in combination with load shedding, efficiency drives, and renewable energy projects, there appears to be less call for smaller independent coal-fired power plants. Few, if any, of these smaller projects have gained traction.

The list of coal projects proposed for Botswana is long. (See the Coal Projects in Botswana tab on this blog.) Most of the projects are at varying stages of preliminary assessment—some are still under review, some have completed detailed feasibility studies, and some are just proposals—but most are currently on hold because of the large capital investments required and low coal prices. Moreover, many of the projects have been suspended because they are export-market driven and require the establishment of railroad infrastructure to Namibia or Mozambique to deliver coal to the international markets.

Coal is a troublesome energy resource. It is cheap and readily available. One tonne of coal, which costs about $50 on the world market, contains 24 000 MJ of energy—or approximately four times that of a $50 barrel of oil. Despite its high energy content, coal needs to be converted into another energy form to be useful: this could be as electricity or, in the case of the Sasol operations in South Africa, into liquid hydrocarbon fuels.

The ready availability and high energy content of coal is offset by the high levels of pollution associated with its use. Coal consists largely of carbon, as well as varying amounts of hydrogen, oxygen, nitrogen, and sulfur. Coal used for electricity generation normally has a carbon content greater than 75% and also contains compounds of aluminum, calcium, and silicon that form ash when the coal is combusted. Coal is also contaminated with deleterious metals, such as cadmium, mercury, selenium, lead, and others. The key problem associated with coal is that, on burning, it releases these nasty elements, as well as fine particulate matter, sulfur dioxide, nitrogen oxides, and carbon dioxide: these all end up in the off-gases and are released into the environment. Some coal plants incorporate expensive particulate-capture and gas-scrubbing units to reduce the emissions, but considerable quantities of these pollutants are still released into the atmosphere. In terms of greenhouse gases and increasing levels of carbon dioxide in the atmosphere, coal is particularly bad and coal-fired electricity is the largest contributor to man-made carbon dioxide emissions.

Coal or fly ash is another problematic byproduct of coal combustion. This consists largely of a fine, non-combustible silica and calcium oxide residue and can contain appreciable amounts of deleterious elements like cadmium, chromium, and others. The ash is stored on-site at power plants or is disposed of in landfills. In some cases, it can be used as a component of Portland cement.

It is all these nasty byproducts (deleterious metals, coal ash, carbon dioxide, fine particulates, and sulfur dioxide) that are behind the widely accepted assertion that coal is a dirty fuel…And this does not even begin to consider the issues associated with coal mining—which is a dangerous, difficult, and complex operation that has significant environmental impacts. Mined coal cannot just be used as is: it needs to be treated through various mineral-processing operations to upgrade its quality and reduce the portion of non-coal components. This beneficiation requires water and also produces a significant quantity of byproducts – known as middlings and discards. These byproducts can represent up to 50% of the mined ore and are typically accumulated on site at the colliery and stored indefinitely. Moreover, the sulfur in this mining waste reacts with air and water to form sulfuric acid which leads to acidic runoff, known as acid mine drainage, which, if not controlled, can contaminate local water supplies.

In a future post, I will take a look at “clean coal” and the many options available to mitigate the harmful effects of coal combustion. Each of these approaches has pros and cons, but in every case there is a significant economic penalty to be paid. As a result, promoting coal projects with state-of-the-art clean coal and pollution control installations requires enormous political will, stringent regulations, and the willingness to take on increased capital and operating costs—which will ultimately result in higher electricity costs. This is a price that many less developed countries are simply not in a position to pay.

When I cover coal as an energy source with my MBA students in the Energy and Sustainability track at Franklin Pierce University, I have them consider the entire value and utilization chain associated with coal, along with its inputs and outputs, so that they can appreciate the complexity and implications of the coal-fired electricity business. A summary of this value chain is reproduced below. As can be seen, the coal-fired electricity business is complicated, with several energy, water, and labor inputs and numerous outputs that have significant impacts on the environment. All of these energy and water inputs and the polluting and harmful outputs need to weighed against the benefits of useful electricity generation—without which our modern lives would not be possible.
Coal Value Chain

Despite these drawbacks, coal will continue to be a very important fuel for a very long time all around the world. Some countries are moving away from coal and closing down aging coal plants, but these countries possess alternative sources of energy, such as those of natural gas and nuclear reactors, and, in some cases, renewable energy from solar and wind. These alternatives are not options for less developed countries like India, China, and much of Africa at present: coal will continue to be a very important part of the energy supply in these countries, regardless of the long-term environmental impacts. Ideally, one would like all coal-related projects to carefully evaluate the long-term environmental impacts of coal mining and coal burning against the immediate benefits of electricity production, but, unfortunately, this is (for various reasons) not always done.

Exploiting the coal resources in Botswana is a challenging endeavor. Mining is straightforward, but, once mined, the coal becomes a stranded resource. It is difficult to export due to the lack of direct rail links to the port of Walvis Bay in Namibia or to Mozambique via Zimbabwe, and there is limited rail traffic to Richards Bay in South Africa. Moreover, exporters of Botswana coal have to compete against large established coal mines in South Africa that have better access to transportation and export networks. There have been several proposals to build rail links to Namibia or Mozambique, but, owing to the cost of these rail links and low prices for coal, there has been little progress of these beyond the discussion stage.

The world is presently awash in coal: demand in countries such as the US and China is down; there is an excess of supply from coal-exporting countries like the United States, Australia, and Indonesia; so coal prices are depressed. The figure below shows spikes in coal prices in 2008 and 2011, which drove a lot of the interest in coal mining and coal-based projects. Since then, however, prices have fallen off considerably and are currently the lowest they have been in the last 10 years.
Source: InfoMine**
The exploitation of coal resources in Botswana is further complicated by the present water crisis in the country. As shown in the value chain above, coal mining and electricity generation require a great deal of water: any coal-related projects need to ensure a steady supply of water in the face of challenging shortages in the country.

Overall, coal exploitation in Botswana can be viewed as being under pressure from five directions, as shown in the figure below: 1) capital investment, 2) coal prices, 3) water resources, 4) environmental impact and increasingly stringent legislation, and 5) lack of transport infrastructure. Pressure can be relieved, to a degree, by exploiting these resources internally, such as by building more in-country power plants and perhaps even coal-to-liquid operations. Even so, such projects need large capital investments, large water requirements, and will still have significant environmental impacts. The successful exploitation of coal in Botswana will require dealing with all of these factors.
Coal Pressure

In my next blog, I will take a closer look at coal projects that do not involve the generation of electricity, particularly those involving coal-bed methane and coal-to-liquid production. Until next time, remember to turn the lights out when you leave the room so that less coal has to be burnt.

Tsamayang Sentle***
Mike Mooiman
mooimanm@franklinpierce.edu


(*Greetings in Setswana)

(**Coal pricing is complicated: it depends on source and destination locations, quality, ransportation, and a host of other factors, so I have just used the North American Central Appalachian price (CAPP) as a proxy for international coal prices.)

(***Go well or Goodbye in Setswana)


Wednesday, November 4, 2015

History of Electrical Energy Generation in Botswana

Dumelang*. In this post, I take a look at historical trends to see how electricity generation in Botswana has changed over time. I noted in an earlier post about Sankey diagrams that Botswana generated only 7% of its electricity needs in 2012. This seemed an extraordinarily low number, so, in my research for this post, I also took a close look at the source data and uncovered some interesting discrepancies.

Utility-scale electricity generation in Botswana began in 1970 with the commissioning of a small oil-fired station in Gaborone. This provided for the needs of the capital and surrounding areas until its decommissioning in 1989. In 1974 a 65 MW coal-fired operation was built in Selebi-Pikwe to service the mining industry. 1985 saw the start-up of a large coal-fired plant at Morupule near Palapye and the shutdown of the Selebi-Pikwe plant a few years later in 1989.  The Morupule operation consisted of four 33 MW air-cooled units, providing a total generation capacity of 132 MW. This operation, known as the Morupule A plant, served Botswana’s needs well for a time. However, with increasing population, electrification of the country, and industrialization, demand rose and increasing quantities of electricity had to be imported from neighboring countries. The construction of the Morupule B coal-fired plant, consisting of four 150 MW air-cooled units, commenced in 2009. The deadline for completion was 2012, but many startup and operational problems have been encountered and today—three years past the scheduled completion date—the new plant has not lived up to its promise. There have been frequent breakdowns and, as a result, a great deal of Botswana’s electricity is still sourced from the Southern African Power Pool (SAPP).

clip_image002
Location of Morupule power plant near Palapye

In the figure below, I have plotted two sets of data for the past 18 years. The orange line shows the percent of electricity generated in-country by the Botswana Power Corporation (BPC), largely from their Morupule operations. The blue bars show the total annual amount of electricity (generated locally and imported) supplied in gigawatt hours (GWh). Data for 2015 are for the first three quarters only.

Data Source: 1997 to 2004; Adjusted BPC annual report results. 2004-2015; Statistics Botswana

An examination of the data shows that, from 1997 to 2008, the amount of electricity supplied steadily increased, with a compounded annual growth rate of 5.7%. During this same period, the proportion of local generation, which was as high as 60% in the late 1990s, decreased. This is to be expected from a fixed source of local generation in the face of increasing demand. However, the decline in local generation accelerated because of operational problems at the aging Morupule A power station. In 2011, an extreme situation was reached, when only 9% of the electricity supply was locally generated.

The difference in supply was made up of imports from the SAPP. However, since late 2008, supply shortages in the entire SAPP region have become acute and electricity imports to Botswana were reduced. As a result, rolling blackouts, also known locally as load shedding, were introduced across the country to curtail demand. Since then, the annual electricity supply has been up and down and there have been some years (specifically 2009, 2011, and 2013) in which energy supply was actually lower than the previous year. Load shedding, combined with the introduction of demand reduction initiatives, prepaid electricity, smart metering, and hot water load control, has slowed the rate of electricity supply growth since 2008 to a compounded rate of ~3% per year.

Since 2012, with the startup of the Morupule B operation, the local supply situation has improved and there have been year-on-year increases in electricity output from this operation. In 2014, Botswana again generated 60% of its electricity demand, significantly reducing the amount of electricity that it needed to import. However, the first quarter numbers for 2015 are disappointing because they indicate a similar level to that of 2014. It was anticipated that this value would be higher, but the performance of the Morupule B plant has been problematic, with only 300 MW of the specified 600 MW generation capacity currently available. We are hopeful for an improvement by the end of the year.

(In my post, The Big Picture, I noted that Botswana only generated 7% of its electricity needs in 2012. However, the historical data in the figure above indicate that this low actually occurred in 2011. My earlier statement was based on data from the International Energy Agency, IEA. A careful analysis of the IEA data led me to conclude that they were using information from the BPC annual reports. Because the BPC financial year ends in March, use of their data requires adjustments to take into account that their annual numbers actually incorporate the last three quarters of the previous year’s data. As a result, IEA reports of low levels of energy generation in 2012 actually correspond largely to the previous year, 2011.)

In my last post, I noted that energy students sometimes confuse capacity factor with conversion efficiency. The concepts are quite different: capacity factor is a measure of how much of the theoretical capacity of an energy-generating device was utilized over a time period (typically one year), whereas conversion efficiency is a measure of the effectiveness of the conversion of one form of energy to another, such as the conversion of energy in coal to electricity. To get a sense of conversion efficiencies, let’s take a closer look at the Morupule coal-fired plant.

According to the data provided by the IEA, the Morupule operation burnt 169 kilotons (kt) of coal and generated 250 GWh of electricity in 2012. To calculate conversion efficiency, we need to compare the input energy in coal and output energy as electricity in the same energy units by converting the energy in coal to GWh equivalents. If we assume that the Morupule plant burns coal with a heat content of 24 MJ/kg (a typical value for Botswana coal), we can calculate that 169 kt of coal contains 7.1 billion MJ of energy. Considering that there are 3.6 MJ in a kWh, we can calculate that the energy input was equivalent to 1126 GWh, which generated 250 GWh of electricity.

With this common set of units, we can now calculate that the conversion efficiency is Input/Output x100 = 250/1126 x 100 = 22%.

In fossil fuel plants, a different measure of conversion efficiency is often applied. This is heat rate, which is the amount of input energy (usually measured in kilojoules (kJ)) that is needed to produce one kilowatt hour (kWh) of electricity. One kWh of energy is equivalent to 3600 kJ, so if a fossil fuel plant is 100% efficient, it would have a heat rate of 3600 kJ/kWh, i.e., the plant would take 3600 KJ or 1 kWh of coal-based energy and convert it into 1 kWh of electricity. A plant operating with 50% efficiency would have double this heat rate or 7200 kJ/kWh (= 3200/0.5). At 22% conversion efficiency, the heat rate would be 16,363 kJ/kWh (= 3200/0.22).

Compared with other coal-fired plants around the world, which have conversion efficiencies of 30 to 40%, this value of 22% seemed extraordinarily low. To understand this discrepancy, I undertook a careful review of the IEA data and determined that they used a standard conversion efficiency of 22% every year to back calculate the amount of coal burnt in producing electricity in Botswana, i.e., their coal consumption numbers are not based on actual coal consumption data! The correct way to do this calculation would be to use the actual coal consumption numbers for the Morupule coal-fired operations. Unfortunately, I have not yet been able to source this data.

Further research led to some old 2006 data from SAPP which indicates that conversion efficiencies for the old Morupule A plant were actually more of the order of 30%. Additional evidence for higher conversion efficiencies was provided by data from the World Bank, which indicate that the heat rates at the Morupule plant were 11,621 kJ/kWh. This is equivalent to an efficiency of 31% (= 3600/11,621 x 100). As a result of this analysis, I am forced to conclude the IEA numbers for coal consumption in Botswana have a high bias.

A conversion efficiency of 30% (although significantly better than a value of 22%) still means that only 30% of the energy in coal ends up as useful electricity. The remaining 70% is lost due to process inefficiencies and heat losses.

To understand why this occurs, we need a better understanding of how the Moropule coal plant works. Coal is burned and the heat produced is used to boil water to generate steam. The steam is used to drive a turbine which then drives an electrical generator. In the process, we have the conversion of the chemical energy in coal, to thermal energy in the steam, to the kinetic energy of the turbine, to the electrical energy leaving the generator. In this process, there are heat losses in the hot off-gases that leave the combustion chamber and then exit those tall stacks at the Morupule operation. Another problem with a steam plant is that steam can only be used once to turn the turbine: it then needs to be condensed into water so that the water can be again be boiled to generate steam. The Morupule plants are air-cooled so the energy that was in the hot steam is lost to the atmosphere during the cooling process. The challenge with air cooling is that this is an energy-intensive operation itself, because large air fans need to be powered to drive air past heat exchangers. A significant portion of the energy generated by an air-cooled plant, typically 10%, is used to run the cooling units, which reduces the amount available for distribution. 

There are certainly coal-fired steam plants that have higher conversion efficiencies. Many modern coal-fired power plants have conversion efficiencies greater than 35% and water-cooled plants, such as those located near rivers or oceans, have even higher efficiencies. The world’s most efficient coal plants have conversion efficiencies as high as 47%. One hopes that, as the operational problems are solved at the Morupule plant, attention will be focused on improving its conversion efficiency to above 30%.

Until next time, remember to turn off those lights when you leave the room

Tsamayang Sentle**

Mike Mooiman
mooimanm@franklinpierce.edu

Click here to be notified of new Energy in Botswana blogposts.

(*Greetings in Setswana)
(**Go well or Goodbye in Setswana)


Friday, October 23, 2015

Electricity Production in Botswana

Dumelang*. My post this week is part informative and part instructional. When we discuss energy issues, a couple of key concepts come up time after time and, to be a contributor to an energy discussion, we have to know, or familiarize ourselves with, some technology and terminology. In this post, I want to explain two fundamental energy concepts. The first is the difference between energy and power, and the second is capacity factor. I will then show how they can be applied to electricity production in Botswana. 

Let's start with the difference between energy and power. These terms are often used interchangeably. This is okay in a general conversation, but in an energy-related discussion, it can lead to confusion, misunderstanding, errors and bad decisions. It is essential to be specific about which term you are discussing, so let’s take a look at distinguishing between the two.

The standard scientific definition is that Energy is the ability of a system to do work. It is the quantity which we need to get something to move, heat up, light up, burn, explode, etc. Energy is not just one thing, however – it comes in different forms, for example, electrical energy, chemical energy, nuclear energy, kinetic energy, etc.: much of energy technology deals with converting one form of energy to another in the most efficient manner. For example, converting the chemical energy in petrol into the kinetic energy of a moving car.  Some of the more common units of measurement for energy are kilowatt hours (kWh), megawatt hours (MWh), megajoules (MJ), and terajoules (TJ).

Power, on the other hand, is the ratio of energy per unit of time or the rate at which energy is produced from a fuel source or is converted from one energy type into another. Units of measure for power include kilowatts (kW), megawatts (MW), joules/second or horsepower (HP).

The confusion between these two often stems from the similarity of the units like kilowatt hours (which is an energy unit), and kilowatts (which is a power unit). However, it is necessary to understand that, even though the units seem similar, there is a world of difference between them. This difference stems from the simple mathematical relationship between energy and power:

Energy = Power x time.

One my students in the Energy and Sustainability program at Franklin Pierce University  noted that energy and power are analogous to distance and speed. Energy, like distance, is a quantity, whereas power is a rate like speed. Like the relationship between energy and power, the relation between distance and speed is written as:

Distance = Speed x time.

Let's consider a simple backup generator that I have been looking at in the Game Store in Gaborone. 


This unit is rated at 5500 Watts or 5.5 kilowatts (kW) under long-term running conditions, so the power of the unit is 5.5 kW. If I were to run this unit for 1 hour, I would produce:

5.5 kilowatts (kW) x 1 hour = 5.5 kilowatt hours (kWh)

of electrical energy that I could use to run my home. Running it for 24 hours would produce 5.5 kW x 24 h = 132 kWh of electrical energy. The power rating of 5.5 kW is a measure of the rate at which the backup generator can take the chemical energy in the diesel fuel and convert it to electrical energy that I can use to keep my home running during load shedding. The larger the motor on the generator, i.e., the greater the power, the faster is the rate of energy conversion.

Let’s take a look at another example. In a car, we convert the chemical energy in petrol into forward kinetic motion to get us from point A to B. Again, the greater the power of the engine, the faster will be the rate of energy conversion. The pictures below illustrate this point.


The Mercedes S500 sedan has a high-powered 5 liter, 302 HP motor that can more rapidly convert the energy in the petrol tank into forward kinetic motion than my rental Toyota with its  1.5 liter, 89 HP motor. These two automobile engines, under specific circumstances, can produce the same amount of energy, however, the Mercedes can do so in substantially less time. It is likely that the Mercedes will do so a lot less efficiently than the Toyota—but with a whole lot more fun.
 
Let's go back to the Ryobi generator unit so that we can discuss the second fundamental concept for this post – capacity factor. If I could run the generator solidly for 24 hours a day for an entire year, I theoretically could produce:

5.5 kW x 24 h/day x 365 day/year = 48 180 kW of electrical energy.

However, if I were to use the generator only for 1 day per month during the year, say during a load shedding, I would produce:

5.5 kW x 24 h/day x 12 days = 924 kWh of electrical energy.

Dividing actual produced energy by the maximum that theoretically could have been generated in a 24/365 scenario produces a ratio called the capacity factor. In my example above, we would divide 924 by 48 180 to produce a figure of 0.019, which converts to a percentage of 1.9%: this would be the capacity factor of my generator for that year. In other words, my generator only ran at 1.9% of its maximum potential output. Students in the energy field often confuse capacity factor with conversion efficiency and it is important to appreciate that they are very different concepts. The capacity factor is a measure of how much of the theoretical capacity of an energy-generating device was utilized over a time period, typically one year. On the other hand, conversion efficiency is a measure of the effectiveness of the conversion of one form of energy, say that in coal, to another form of energy, for example, electricity. We will be taking a look at conversion efficiencies in a future post.

With these basic terms—energy, power and capacity factor—under our belts, let's turn back Botswana energy issues and particularly electricity generation.

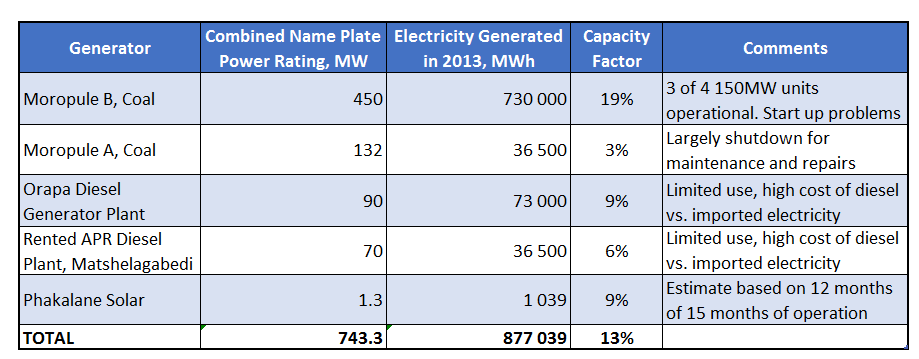
I have examined the 2013 electricity generation figures for Botswana that were published in the Botswana Power Corporation (BPC) 2013 Annual Report and have combined, in one table, the  generating units, their combined power, the energy produced from these units, the  calculated capacity factors, and the overall capacity factor for the combined generators in Botswana.


In 2013, there were five energy-generating operations, including the new (and trouble-prone) generators at Moropule B, the aging and largely shutdown Moropule A operations, two large-scale diesel generating operations, one near Orapa and the other near Francistown, and the 1.3 MW solar plant in Phakalane. The combined nameplate capacity of the generating units was 743 MW and they generated just over 877 000 MWh of electrical energy for an overall capacity factor of 13%. (Note that there are 1000 kilowatts in a megawatt, similarly there are 1000 kilowatt hours in a megawatt hour.)

On examining the capacity factors, it is interesting to note how far they are from 100%. The only way a generating device can run at a capacity factor of 100% is by running 24 hours 365 days a year—which is simply not practical or realistic. Equipment breaks down and has to be repaired or has to be shut down for maintenance. Moreover, operators of power plants make operating choices, based on the cost of coal and diesel compared with that of imported electricity, as well as demand to throttle back their units from their rated or name plate capability. This reduces the amount of electricity produced which, in turn, reduces the capacity factor. However, the low capacities of the coal-fired units are of concern. Typically, coal-fired plants have capacity factors that range from 50 to 80%, depending on location and demand. Low capacity factors for coal-fired plants result from either low demand or operational issues. In the case or Moropule B, the problems that have plagued the startup of new generators have been extensively reported on in the media.

Generating electricity using diesel is an expensive proposition and therefore the low capacity factors of diesel plants are not surprising. These units are seldom used and they function as back-up generators and are only used in an emergency. In many respects, they are just like the Ryobi generator I presently have my eye on.

Even though the Botswana-based generating units are operated separately with different technical and economic considerations, it is useful to consider their aggregated capacity. As noted above, the combined nameplate capacity of the generating units is 743 MW. This combined capacity in a single unit would be one mammoth-sized generator – we could call it the "Botswana Megarac 743" – which is almost a 140,000 times larger than the Ryobi unit I am eyeing at the Game Store in Gaborone. Looking at this another way, if Botswana bought 140 000 of these units, it would match the country’s present generating capacity.


Based on 2013 financial year data, this Botswana Megarac 743 was operated at a capacity factor 0.13 which means the combined Botswana facilities only generated 13% of the electricity that was theoretically possible. Over time, it is hoped that the start-up problems at Moropule B will be solved and the overall capacity factor for Botswana’s generating facilities will increase. However, we need to keep in mind that practical considerations, such as cost and availability of imported electricity, will also have to be factored in and that Botswana electricity generation is not an island unto itself. Botswana draws electricity from the Southern African Power Pool (SAPP) power generation and transmission system which coordinates electricity supply and demand throughout Southern Africa.  The SAPP system has a combined capacity of about 55 000 MW of electrical generating capacity.

Hopefully, this has been an informative and instructional post and you now know the difference between energy and power and you have an appreciation for capacity factors. As you can see, capacity utilization of generating facilities is low in Botswana: hopefully this will improve in the future, but it is crucial to appreciate that not all of this capacity can be tapped at any one time. Running these generators depends on complex issues, which include demand, cost and availability of fuel, maintenance shutdowns and financial considerations.

In the meantime, if you see me in the parking lot at the Game Store in Gaborone trying to load up that Ryobi generator into my rental Toyota, stop and give me a hand. Until next time, remember to turn off those lights when you leave the room.

Tsamayang Sentle**
Mike Mooiman

(*Greetings in Setswana)
(**Go well or Goodbye in Setswana)


Saturday, October 17, 2015

The Big Picture – Energy Supply and Consumption in Botswana

Dumelang.* The best way to approach most country- or statewide energy considerations is to understand the big energy flow picture. To do so, we use Sankey, or flow, diagrams which are often used in the energy industry, an example of which is shown below. In these diagrams the magnitude of the flow of energy is indicated by the width of the arrow. These diagrams were first used in the energy field by an Irish engineer and captain in the British army, Matthew Henry Phineas Riall Sankey, in 1898, to illustrate energy flows in steam engines. The modern version below neatly shows how input energy into a steam engine, in the red flows, is lost to smoke, friction, and heat loss via the steam condensor. Useful energy as forward motion of the steam engine, a small recirculating flow of energy that comes from the recirculated condensed water and a small amount going to the alternators are shown as the blue flows.


The great thing about Sankey diagrams is that they are not restricted to energy flows. They can be applied to quantities of many types. For example, material and cost flows are often depicted. One of the most famous of these flow diagrams is that prepared by the French engineer, George Charles Minard, in 1869, and shown below. This illustrates the fate of Napoleon's army in 1812 – 1813 as they progressed through their disastrous Russian invasion. The width of the lines shows the fate of the invading army. Napoleon crossed into Russian with 422,000 men and, through attrition, minor skirmishes, and some great battles, he entered a largely abandoned Moscow with about 100,000 men under his command. He then turned back to return to France: on the way back, starvation, battles, and incessant harassment by guerilla forces decimated his army to 10,000 survivors. The harsh winter also took its toll on his men - the line graph below the flow diagram shows the decreasing temperatures encountered on the army's return from Moscow. The diminishing width of the flow is a skillful, albeit harrowing, representation of what was happening to the army in the field, the prisoners that were taken, and the lives that were lost. 


But I digress… Let's return to energy flows. I have prepared the following Sankey diagram for energy flows in Botswana, based on 2012 data from the International Energy Agency (IEA). The IEA have prepared Sankey diagrams for most countries in the world (including Botswana), and, although this is a wonderful source of data, their flow diagrams are two-part figures showing a complicated spaghetti of flows. I have taken their data and distilled it down to the more easily understood diagram shown below.


Although I am highly impressed with the data that the IEA has collected for most of the world’s countries, we need to be cautious about some of the numbers. In my previous post, I pointed out some discrepancies regarding biofuel usage. I am, as yet, not in a position to verify all the Botswana-related data that the IEA has collected, but I hope to do so over the next year.

There is a lot of data incorporated into this diagram, so let’s work from left to right to get a sense of some of the larger flows. On the left, we have the energy sources for Botswana. There are only four types: local biofuel (wood), imported electricity, locally mined coal, and imported oil products. For 2012, the total energy supply available in Botswana was 109,165 terajoules (TJ), as shown in the pie chart below.


Almost one half of Botswana’s energy supply is in the form of oil products, such as petrol and diesel. The green flows in the Sankey diagram show that these are mainly used in transportation and industry. The small flow to non-energy applications show use largely as lubricants, oils and greases, for industry and transportation.  Biofuel, largely wood, is still very important in Botswana: the brown biofuel flows show that all wood is used in household applications, most likely for cooking and heating in the rural and poorer areas.

As shown by the black Sankey flows, Botswana produces a good amount of coal. Much of this was stockpiled in 2012, but a fair quantity was used by industry and about 11% was used for electricity generation at Botswana’s only coal-fired station, Morupule, which is near the town of Palapye. However, Botswana does not generate sufficient electricity for its own needs. If we refer to the center of the Sankey chart and we follow the red flows, we can see that, in 2012, Botswana only produced a small portion, 7%, of its domestic energy needs. The bulk of its electricity was imported from the Southern African Power Pool grid and came from Mozambique and South Africa. The bulk of this electricity is used by industry, followed by households, and the commercial and public sector.

In my last post I noted that energy consumption for 2012 was 86,206 TJ. The large difference between the 109,165 TJ of supply and the 86,206 TJ of consumptions accounted for by several reasons:
  • More coal was mined than was actually used. The difference ends up in stockpiles to be used in the future.
  • Electricity generation in coal-fired power plants is very inefficient. Only about 23% of the energy in coal ends up as electricity.  
  • Transmission and distribution of electricity to end users results in line losses of the order of 8 to 10%.
  • There are small differences due to statistical variations, own use, and storage of petrol and diesel at various locations.

The overall usages of energy by the main categories, as shown on the right of the Sankey chart and the pie chart below are split as follows: transportation uses just over one-third, followed by households, and then industrial use.


So here you have the overall energy picture for the country of Botswana, at least for 2012.  It will interesting to see over the next year or so, as I collect current data, how much this picture will change.

Until next time, feel free to comment on my post and remember to turn off the lights when you leave the room.

Tsamayang Sentle**


Mike Mooiman
mooimanm@franklinpierce.edu


(*Greetings in Setswana)
(**Go well or Goodbye in Setswana)


Monday, October 12, 2015

Welcome to Energy in Botswana

Dumelang. My name is Mike Mooiman. I am a visiting professor from the US and Fulbright Scholar at the University of Botswana, where I am associated with the Clean Energy Research Centre at the university. I am here in Botswana until June 2016 to study energy issues and, particularly, battery storage associated with off-grid solar projects. I have been studying, teaching and writing about energy issues in the State of New Hampshire for a number of years now and my other blog, “Energy in New Hampshire”, has resonated well with regulators, legislators, academics, business people and the general public in New Hampshire. I hope to accomplish the same here in Botswana. The objective of this blog is to inform and educate students and the general public about energy issues in Botswana. Through my writing and research, I learn and educate myself and, as a reader, I hope that you will learn something in the process as well.

Information here can sometimes be very hard to come by and I am pretty sure that there will be times that I will, in my analysis and opinion, completely miss the point because I don’t have all the information—but that is one of the joys of blogging. Through your comments and insights, I will be able to correct and update the data and posts I have presented and, over time, build up a useful database of information about the energy situation in Botswana. So please do not be shy about commenting on my posts – I want your input and perspective.

Just a quick word about my background: I am an engineer by trade but have spent a good deal of my career managing and owning businesses. During these years, I have always worked at the intersection of technology, finance and energy. I developed an early interest in designing new processes, working to make them energy-efficient, and getting them funded on the basis of energy savings. The energy field has always appealed to me because it is so vitally important to our economic wellbeing, standing squarely at the intersection of technology, finance and policy. Even if we don’t think about it much, energy and energy issues permeate our lives and daily activities. There is nothing we do that does not have some energy component to it.

At my home university, Franklin Pierce University in New Hampshire, I have also had the opportunity to build a new type of MBA – one that looks at energy from a business and sustainability viewpoint. This is our MBA in Energy and Sustainability Studies. In this program, students can spend 25% of their MBA studies studying and thinking about energy and sustainability matters. It is our goal that these students will enter the workforce with a good understanding of energy issues and that they will be able to assist and direct the organizations they join in these matters. In fact, many of our graduates are already doing so: some are working for wood-burning power plants, some for solar companies, and others for large wind-power operations.  

I first visited Botswana in 1985 with my brother when we took a drive from Johannesburg to Maun and, in a trip of a lifetime, made our way into the Okavango where we spent several days touring the delta with a guide in his mokoro. I have always wanted to return to Botswana and, 30 years later, I have finally done so.

Even though my main research topic is very much focused on storage of solar-generated electricity, I will be undertaking a deep study of the energy concerns in this country to provide context for my project. As part of my research, I chat to people, read a lot, and work hard to find information so I that can present the facts about energy matters. As a visitor to this wonderful country, I am here to learn and understand and I will do my best to avoid taking hard positions on difficult energy issues. Ultimately, it will be up to the citizens of Botswana, their elected leaders, government officials and regulators to make the decisions that will work best for them. However, I have learnt that decisions about energy issues are best done with as much information and data as possible and hopefully this blog will, in a small way, provide some of that information and illumination.

Unfortunately, Botswana is not an energy “island”: it does not generate sufficient energy for its own needs and is very dependent on imports of energy, particularly electricity and fossil fuels, from other countries in Southern Africa. Therefore, when considering energy matters in Botswana, one often has to consider them in the broader Southern African context: many of my posts will consequently cover matters of wider regional concern.

Before I jump into energy issues in Botswana, I would like to present some details about the country to provide some background information for my readers from the US.

So here are some basic facts about Botswana:
  • It is a landlocked country in Southern Africa, sharing borders with South Africa to the south and east, Namibia to the west and north, Zimbabwe to the east, and— in the shortest border in the world—with Zambia for ~150 meters in the very north.
  • During the period from 1880 to 1966,Botswana was a British Protectorate known as Bechuanaland: on independence 49 years ago, its name was changed to Botswana.
  • It has a population of about 2 million and a land area just slightly less than that of Texas.
  • Since independence, it has had a stable democracy and astute leadership. It has avoided many of the problems, such as political instability, wide-spread corruption, and press censorship that have plagued many other African countries.
  • It has a great deal of mineral wealth, largely in the form of diamonds, with some copper and coal.
  • 80% of the country is covered by the Kalahari Desert and 80% of the population lives in the eastern part of the country which is home to most of the large urban areas. Approximately 60% of the population has migrated to these urban areas.
  • The capital and largest city, with a population of about 250,000, is Gaborone.
  • It is also home to several universities. The largest is the University of Botswana with a student body of ~17,000.

Gaborone, which is my home for the next year, is an interesting and rather random mixture of new and old. It has modern casinos and shopping malls, intersecting with traditional ways of life and simple homes, and cattle wandering down the main roads. Many of the residential communities are a hodgepodge of new and old, with large mansions built right next to humble homes.

Botswana is a hot, dry and dusty country with warm winters and very hot summers, where temperatures exceeding 100oF (38oC) are common. At present, the water situation in the southern part of the country is problematic and Gaborone and surrounding areas are suffering from profound water shortages: just recently, the city was without water for several days in a row. The situation is anticipated to get worse as we move into the summer. The rainy season is October through February but the forecast for this year is for a drought. Added to this, there has recently been news that South African dams, which supply 16% of Gaborone’s water, are contemplating cutting off supply due to the drought and very low dam levels on their side of the border. It looks like it will be an extra hot and very dry summer coming up. With some of those basic facts about Botswana under our belt, let us turn our thoughts to matters of energy.

The first issue I have to deal with when it comes to information about energy is: where do I find the information? In my research of the past few years, which involves US states, I have regularly turned to the Energy Information Agency (EIA) of the US Government, so this was my starting point. I found that the EIA has some information regarding other countries and, according to them, the 2012 energy consumption for Botswana was 65,415 Terajoules (TJ or 1012 J).

However, I wanted to confirm this number so I went to the energy data base of the International Energy Agency (IEA) which does a good job of collecting global numbers through surveys. According to this source, energy consumption in 2012 for Botswana was 86,206 TJ. Now this is a 32% increase over the EIA numbers—which can hardly be accounted for by statistical differences! As I continued my research, I came upon some energy data from the United Nations (UN) which indicated that the 2012 energy consumption was 69,904 TJ. Now this is closer to the EIA number, but still does not help resolve the discrepancies. As a result, we have the three sets of numbers shown in the following table.


An examination of the data underlying these numbers indicated very different estimates for the consumption of biofuel (wood). The IEA numbers were 4.5x higher than the UN estimate. Developing reliable biofuel consumption estimates is very difficult for developing countries and certainly bears further investigation: this will be a topic for a future blog.  For the moment, I am going to go with the IEA numbers simply because I know their numbers are highly regarded in the international energy community and they appear to do a good job of data collection and analysis.

There is a Department of  Energy within the Botswana Ministry of Minerals, Energy and Water Resources but, at least at this time, current information regarding energy supply and consumption is hard to come by. The most recent set of data is from 2008 and does not include estimates of biofuel consumption.

For most folks, numbers such as terajoules are somewhat difficult to relate to or comprehend. I find it useful to convert these to number of barrels of oil per person. Most of us have a sense of the size of a barrel of oil (which contains 42 gallons or 159 litres) so these units allow some comprehension of the magnitude of these energy values. If Botswana’s energy consumption is 85,228 TJ for a population of about two million, this works out to 0.042 MJ per person, which is equivalent to 7 barrels of oil per person for the year.  Compare this to New Hampshire, where the annual energy consumption for 2012 was 298,579 TJ for 1.3 million people or 38 barrels of oil per person.  

New Hampshire’s per capita consumption is 5.3x that of Botswana. The fact that the US per capita energy consumption is so much greater than that of other countries in the world is hardly a new fact, but, having just left New Hampshire for Botswana, it did resonate with me. Of course, many reasons contribute to greater energy consumption of this US state, such as its colder climate, the higher standard of living, and the higher level of economic output, but the differences are, as shown in the figure below, still stark and are food for thought. 


So I leave you contemplating the figure above. Welcome to “Energy in Botswana” and don’t be shy about weighing in.

Until next time, remember to turn off the lights when you leave the room.

Tsamayang Sentle*
Mike Mooiman
mooimanm@franklinpierce.edu

Click here to be notified of new Energy in Botswana blogposts. 

(*Go well or Goodbye in Setswana)